Investing in a snus or nicotine pouch packing line is a major step for any manufacturer aiming to scale production and improve margins. This guide walks through a practical ROI analysis for snus machines, explains how to calculate the payback period, and outlines proven strategies to maximize production profitability. Follow these steps to make data-driven decisions and accelerate your return on investment.
What ROI Means for Snus Packaging Lines
Return on investment (ROI) measures how quickly and effectively an investment in equipment converts into profit. For snus machines, ROI depends on machine price, throughput, labor savings, material usage, downtime, and downstream value such as improved product consistency and reduced waste. When evaluating machine purchases, consider both quantifiable savings (reduced labor, faster cycle time) and qualitative benefits (brand consistency, regulatory compliance).
Basic Payback Period Formula
The payback period estimates how long it takes for cumulative net cash inflows to equal the initial capital outlay. Use this simple formula:
Payback Period = Initial Investment / Annual Net Cash Inflow
📈 Quick example: A multi-lane snus packing line priced at $450,000 that produces net incremental cash flow of $150,000/year has a payback period of 3 years.
Breaking Down the Numbers: CapEx and OpEx
To model ROI accurately, separate capital expenditures (CapEx) and operating expenses (OpEx). CapEx includes machine cost, installation, tooling, conveyor and integration, and any line automation. OpEx includes consumables, maintenance, labor, energy, and spare parts.
Typical cost categories:
Machine purchase, installation, training, maintenance, and spare parts.
Estimating Revenue and Cost Savings
Revenue drivers include additional throughput, higher fill accuracy (less giveaway), and entry to higher-value SKUs. Cost savings often come from reduced labor per unit, lower material waste, and less rework. Calculate these drivers on a per-month or per-year basis for realistic payback modeling.
Tip: Always model conservative scenarios (low case, base case, high case) to understand risk. A 10–20% variance in throughput dramatically changes payback timing.
Step-by-Step Payback Calculation for a Snus Line
Follow these steps to build your payback calculation:
1) Define Initial Investment
Include machine cost, auxiliary equipment, control systems, installation, and commissioning. If you are upgrading multiple lines, include integration expenses.
2) Calculate Incremental Annual Benefit
Sum projected additional revenue plus annual cost reductions:
- Extra units sold × price per unit
- Labor hours saved × wage rate
- Material waste reduction × material cost
- Quality-related returns/rework avoided
3) Subtract Additional Operating Costs
Include energy, increased maintenance, consumables, and any new staffing needs. The net amount equals incremental annual cash inflow.
4) Compute Payback
Divide the initial investment by the net annual inflow. For a more complete investment picture, calculate NPV and IRR with expected cash flows over a 5–7 year horizon.
How to Maximize Production Profitability
Beyond selecting the right machine, several operational strategies amplify ROI. Focus on line efficiency, product flexibility, and lifecycle cost reduction.
Optimize Line Efficiency (OEE)
Overall Equipment Effectiveness (OEE) combines availability, performance, and quality. Small improvements in OEE can produce outsized financial impact. Implement preventive maintenance, quick changeover tooling, and real-time production dashboards to maximize uptime.
Choose Modular, Scalable Machines
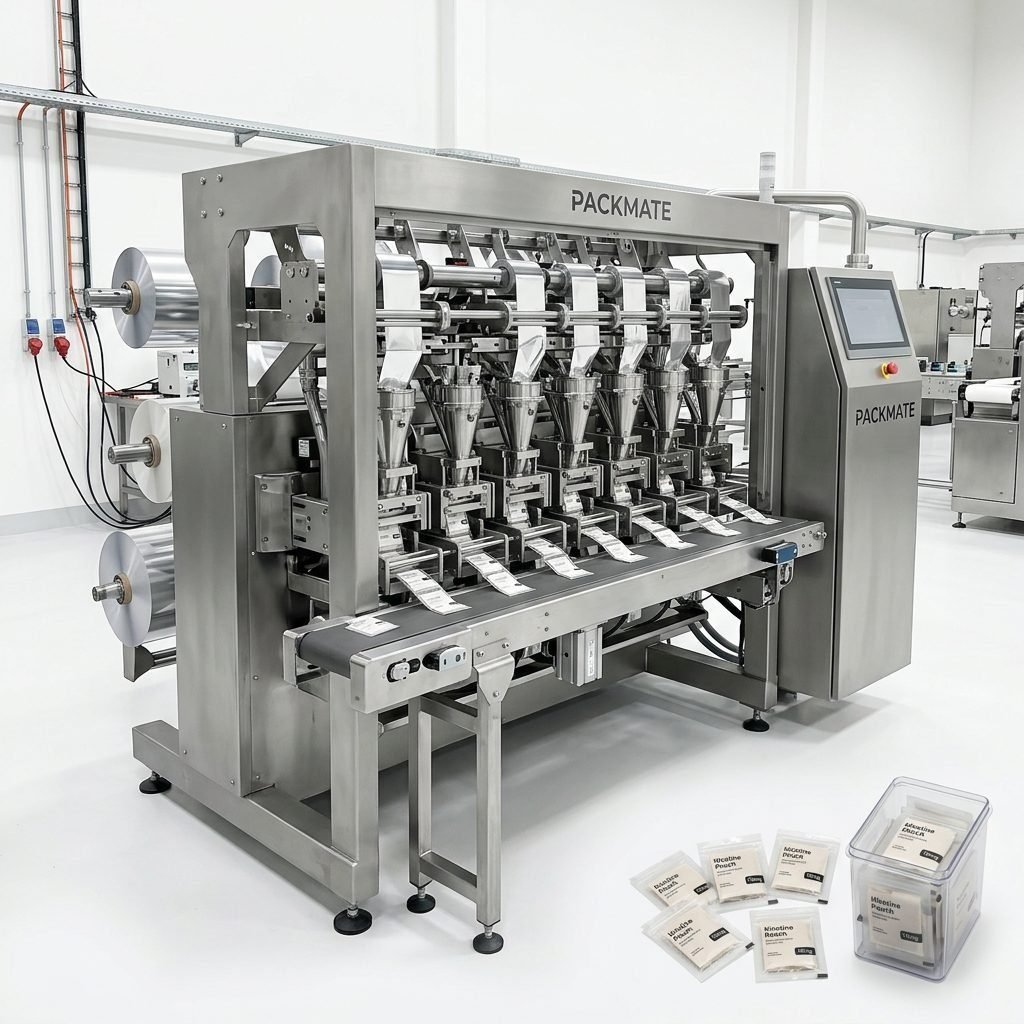
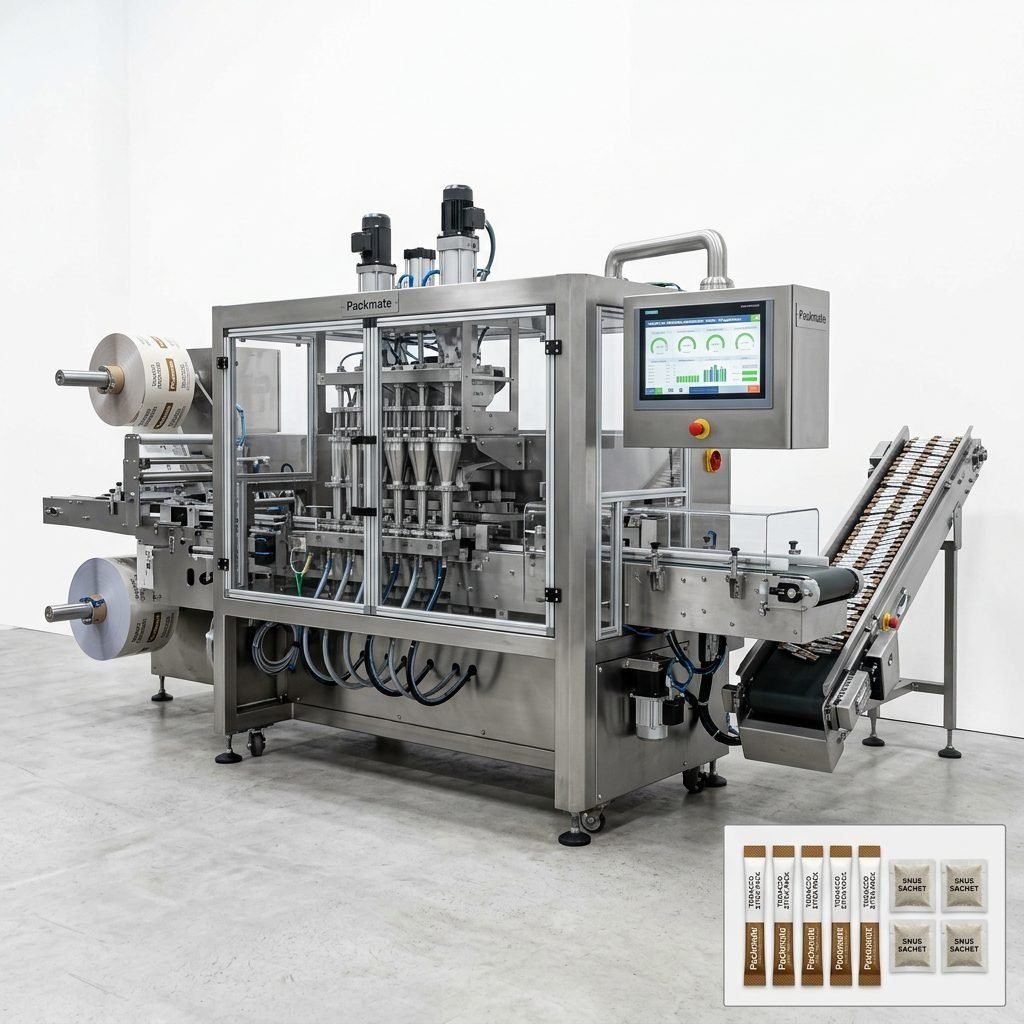
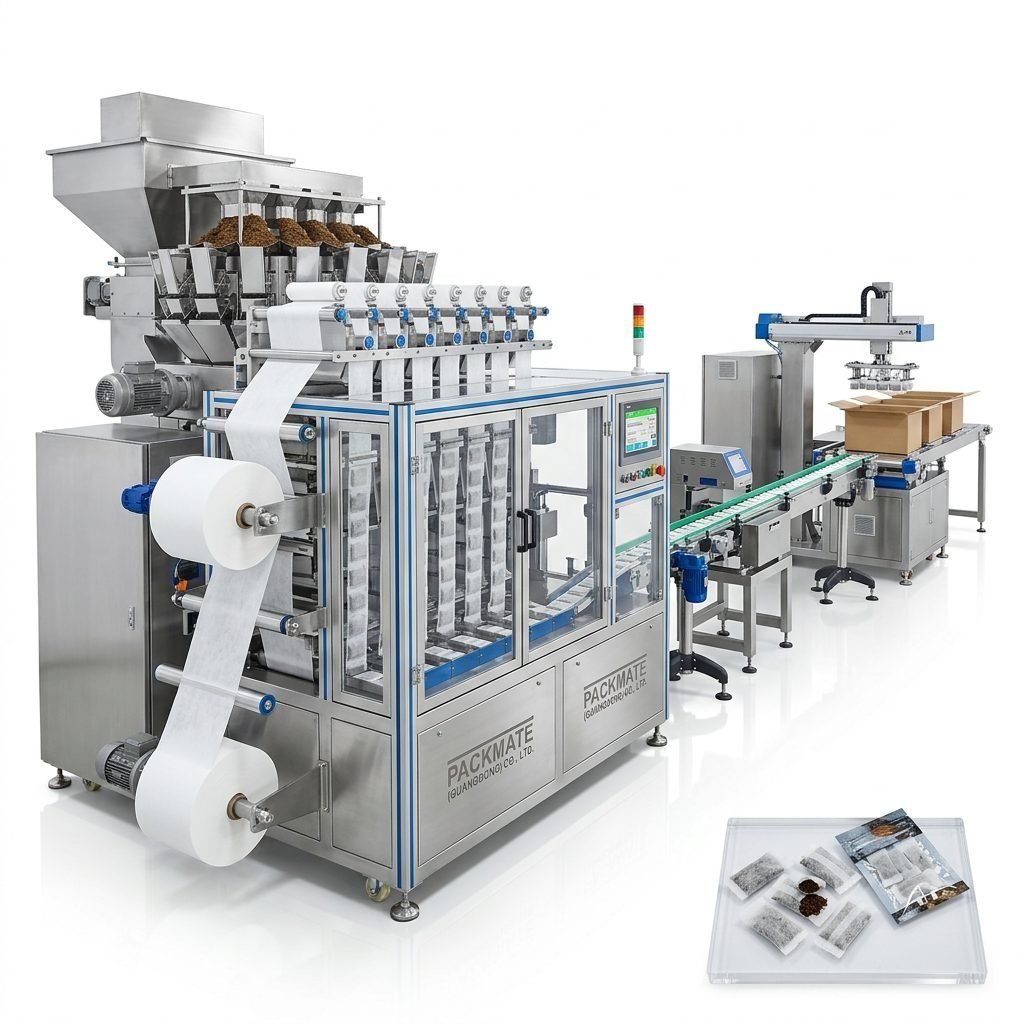
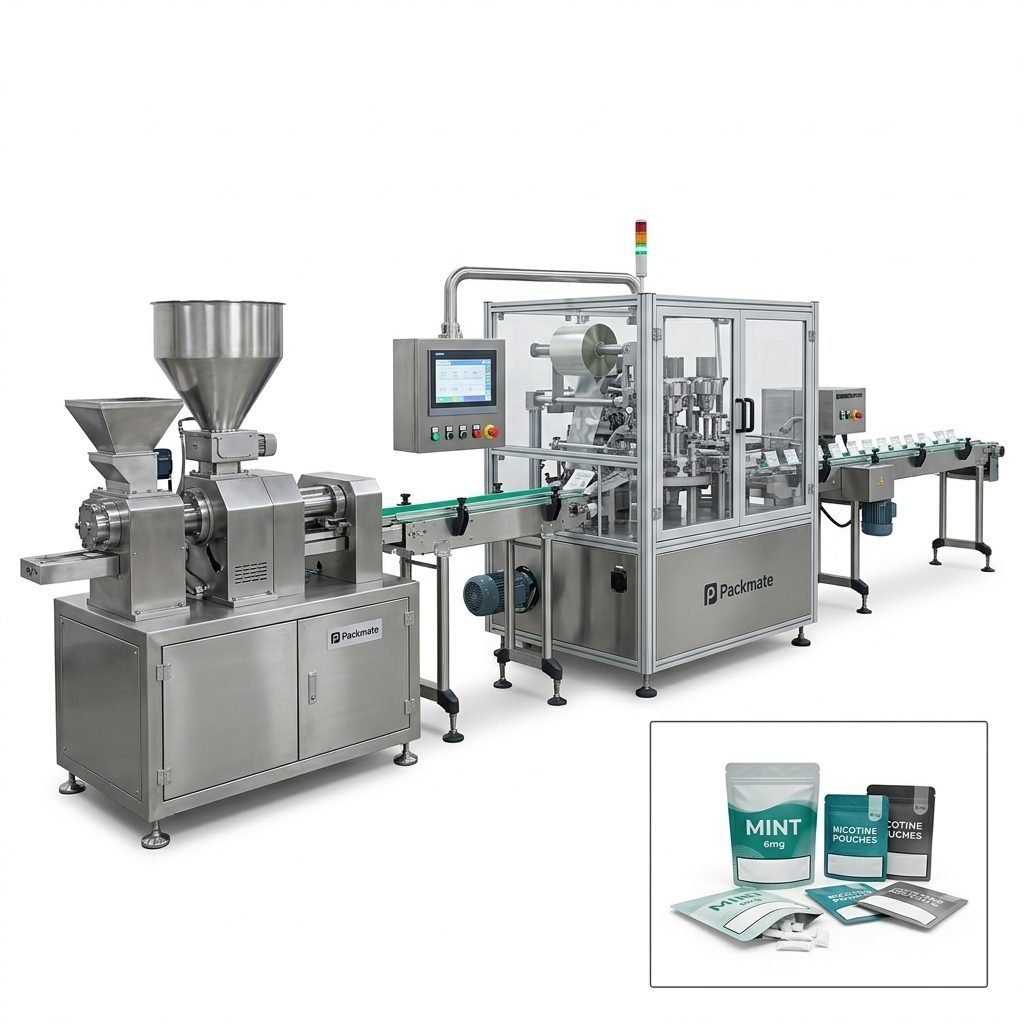
Modular machines allow you to add lanes or integrate new filling modules as SKU demand changes. Explore Snus & Nicotine Packaging Machines with multi-lane options to scale throughput without complete replacement.
⚙️ Operational focus: Train operators for quick troubleshooting, keep a recommended spare parts kit, and document changeover recipes for each SKU to reduce downtime.
Invest in Quality Controls
Inline checkweighers, vision systems, and leak detection reduce recalls and brand damage. The cost of these systems is often recovered through fewer customer complaints and lower waste.
Sample Payback Scenario: Multi-Lane Snus Line
Consider a practical scenario for illustration:
– Initial investment (machine + integration + spares): $450,000
– Expected additional output: 12 million pouches/year (after scale-up)
– Selling margin contribution per pouch: $0.05 (net)
– Annual incremental gross profit: $600,000
– Additional operating expense increase (energy, maintenance, consumables): $120,000/year
– Net annual cash inflow: $480,000
Payback Period = $450,000 / $480,000 ≈ 0.94 years (under these assumptions)
Note: This optimistic example assumes high market demand and full-line utilization. More conservative estimates (80% utilization or lower margin) will extend payback. Run sensitivity analysis with different utilization rates, margin assumptions, and downtime scenarios.
Sensitivity Analysis Tips
Model three scenarios:
- Conservative: 70% utilization, lower margins
- Base: 85% utilization, expected margin
- Aggressive: 95% utilization, premium margin or new contracts
Important: Factor in planned downtimes for maintenance and unplanned stoppages when forecasting utilization.
Financing, Depreciation and Tax Considerations
Financing terms and tax treatment affect effective ROI. Leasing may reduce upfront cash requirements while preserving credit lines. Depreciation schedules and capital allowances vary by country — consult your finance team. If needed, explore vendor financing or government incentives for manufacturing modernization.
Manufacturer Selection and Lifecycle Support
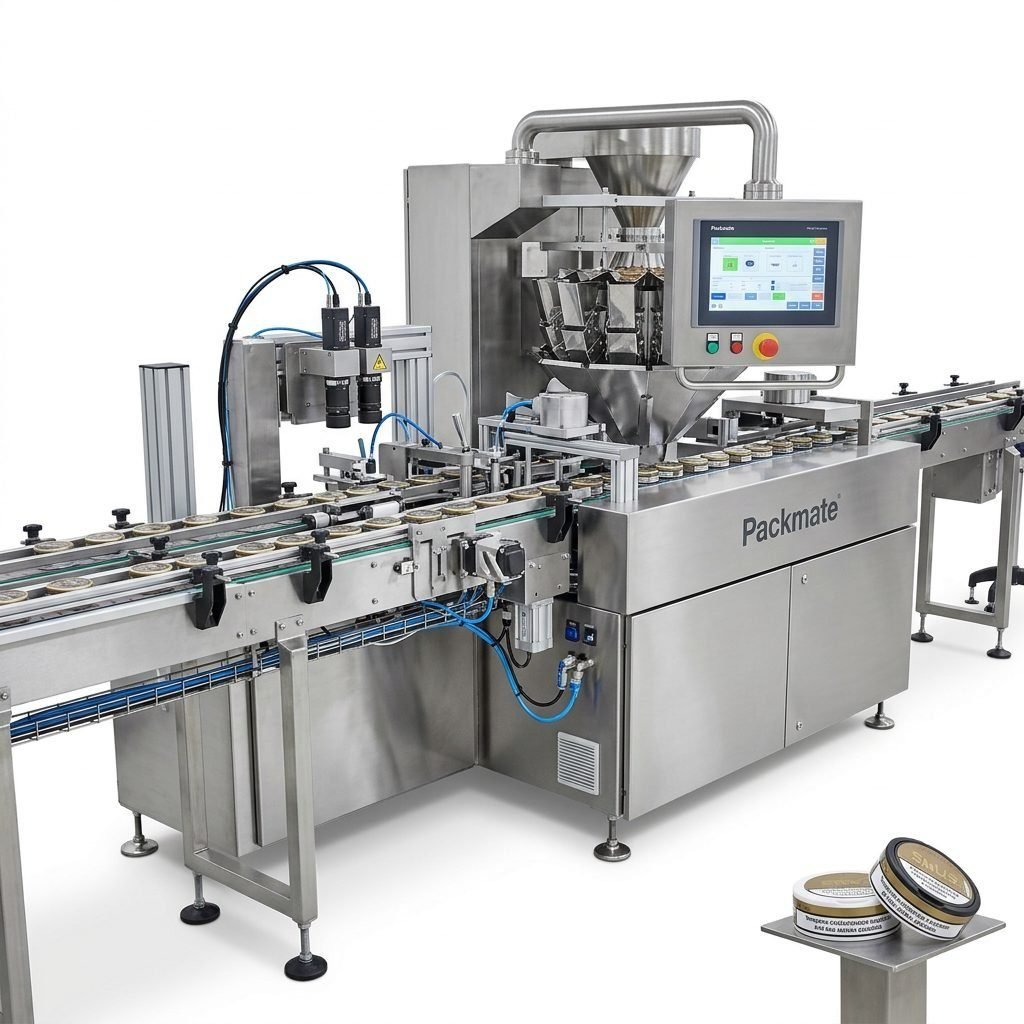
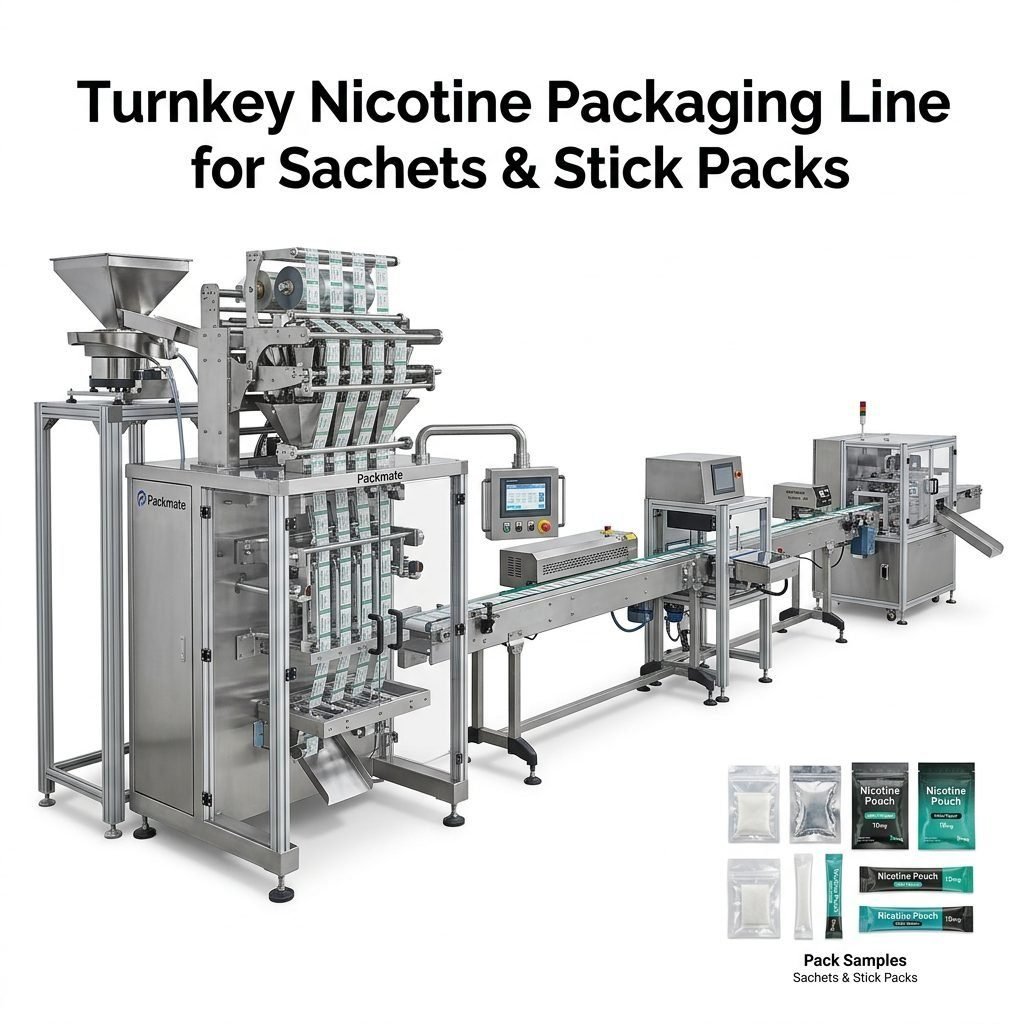
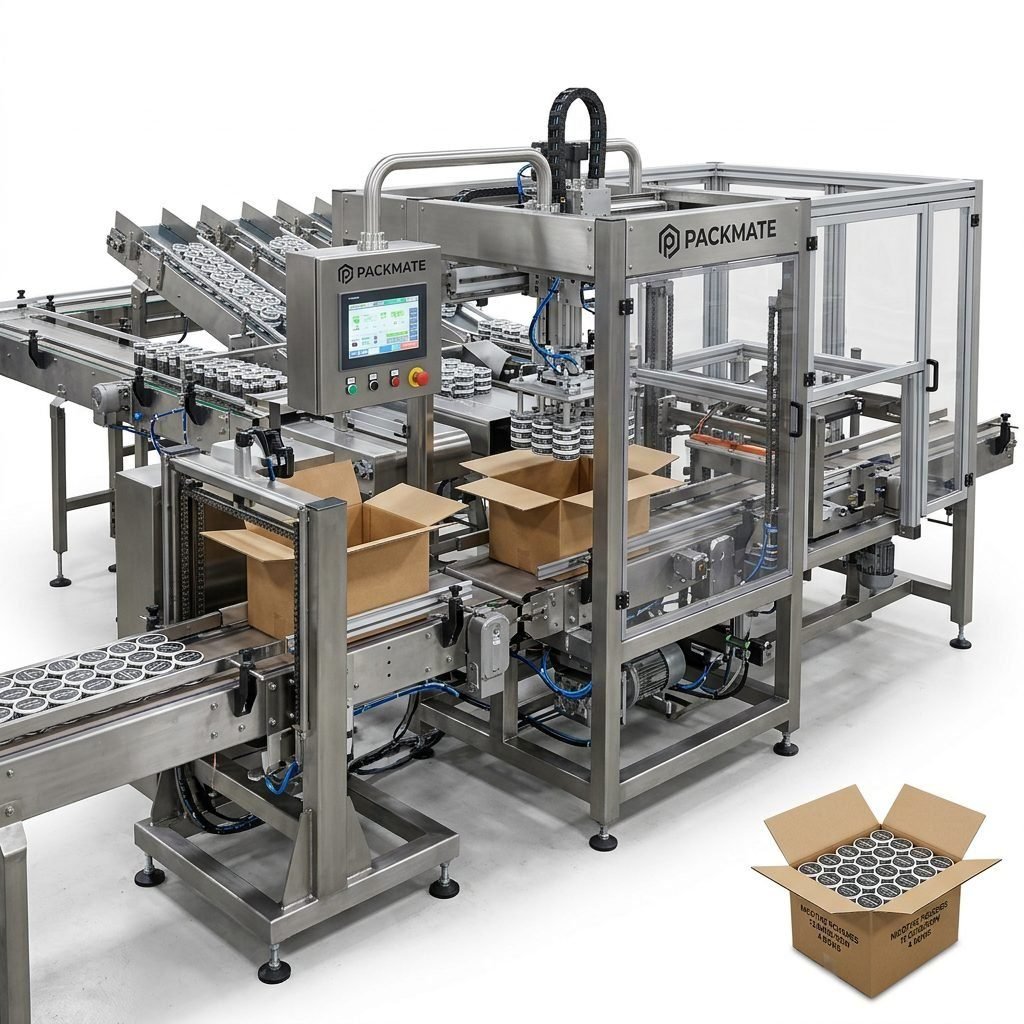
Choose suppliers with strong service networks and spare parts availability. Packmate Snus Machine offers turnkey solutions, multi-lane machines, and a 20,000㎡ factory with CNC capabilities, which can reduce lead time and ensure consistent quality. Learn more about company capabilities and certifications on the About Packmate page.
Why case studies matter
Real-world case studies reveal typical throughput gains, changeover results, and maintenance cycles. Review examples in the manufacturer Case library to benchmark expected outcomes.
Operational Best Practices to Protect ROI
Operational discipline ensures projected savings are realized. Key practices:
- Documented setup and changeover procedures
- Operator skills matrix and targeted training
- Spare parts inventory aligned with MTTR goals
- Scheduled preventive maintenance with KPIs
- Quality assurance gates with data logging
Leveraging Supplier Services
Consider extended service contracts, remote monitoring, and annual audits to maintain performance. Many manufacturers, including Packmate, provide installation support, commissioning, and ongoing service plans to protect uptime and ROI — see Service.
✅ Final operational reminder: A well-documented handover and operator training program often saves months of troubleshooting and is one of the fastest ways to secure ROI.
Selecting the Right Model for Your Business
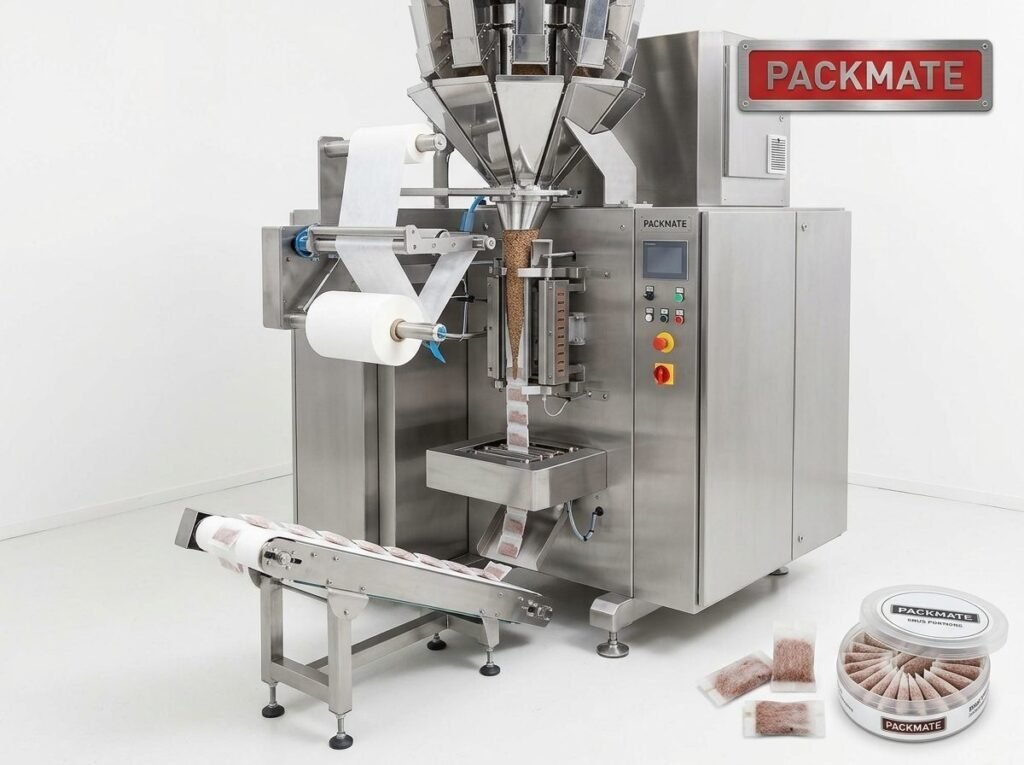
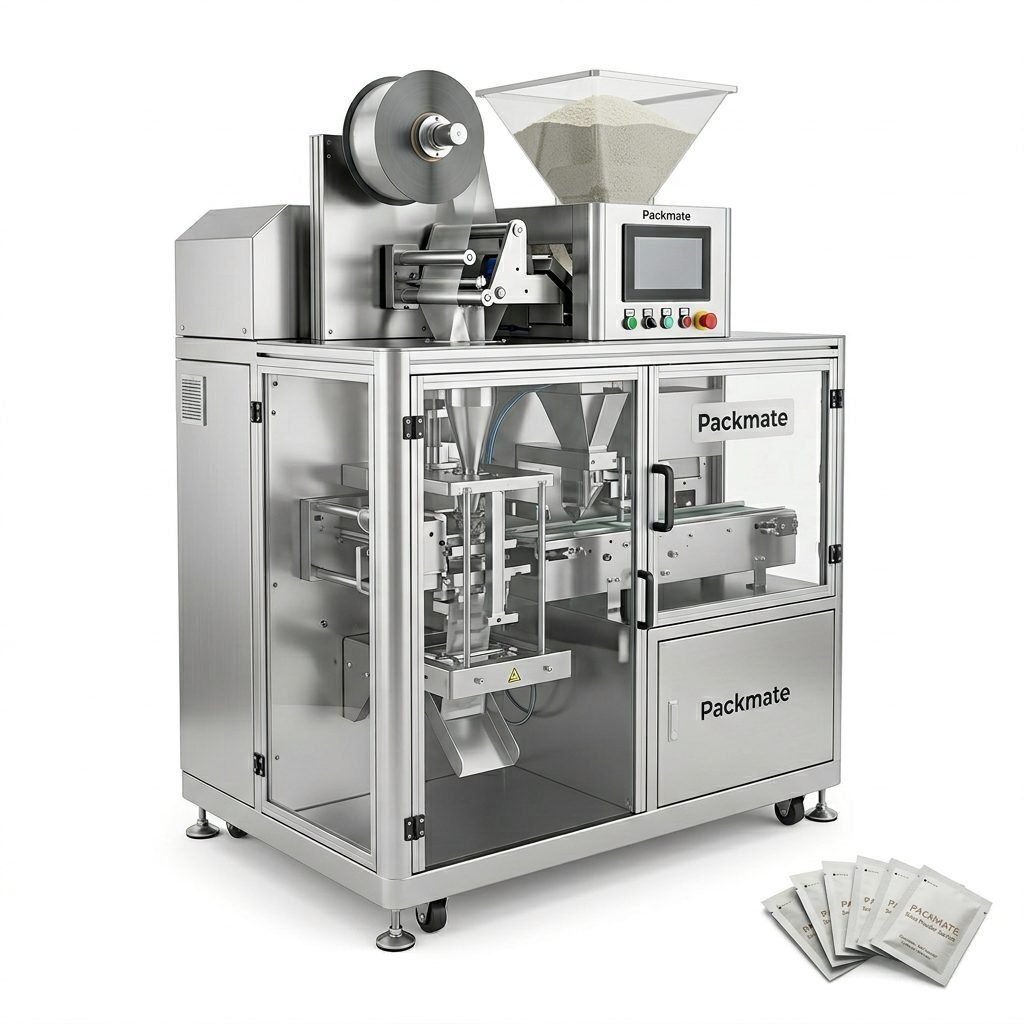
When choosing a machine, match capacity to demand, consider multi-lane scalability, evaluate fill accuracy specifications, and ensure compatibility with your downstream packaging. Review product categories such as Sachet & Stick Pack Machines and Filling & Packaging Lines to identify options that balance CapEx with long-term productivity.
Checklist Before Purchase
– Confirm throughput vs. market forecasts
– Validate sample production and changeover time
– Review spare parts list and lead times
– Agree on SLAs for uptime and response time
– Include installation and training in quotes
Next Steps: Run Your Own ROI Model
Start with a spreadsheet capturing one-time CapEx and recurring OpEx, then forecast revenue uplift and margin improvement. Run sensitivity scenarios and compare payback, NPV, and IRR. If you need samples, capacity guidance, or a tailored quote, contact the manufacturer directly via Contact Us.
Useful Resources
For machine specifications and turnkey system options, review Packmate’s portfolio of snus and nicotine packaging equipment to align technical choices with business goals: Snus & Nicotine Packaging Machines.
Frequently Asked Questions
Q: How long does a typical snus packing machine payback take?
A: It varies widely. In high-demand scenarios with strong margins and effective utilization, payback can be under 2 years; more conservative cases commonly stretch to 3–5 years. Run sensitivity analysis to reflect your market.
Q: What are the hidden costs that can delay payback?
A: Common hidden costs include integration with existing lines, changeover setup time, spare parts procurement delays, unplanned downtime, and additional quality control systems. Factor these into your OpEx.
Q: Should I buy the largest capacity machine available to future-proof production?
A: Not always. Oversizing increases CapEx and may lower utilization, extending payback. Opt for modular machines that allow capacity expansion or lane addition as demand grows.
Q: How can service agreements influence ROI?
A: Strong service agreements reduce downtime and protect throughput, often improving realized ROI. Consider including uptime guarantees, spare parts availability, and training in the contract.
Q: Where can I see real-world examples of snus packaging lines?
A: Browse manufacturer case studies and exhibition demos to benchmark performance. See Packmate’s case library and exhibition records for machine demos and implemented lines: Case and Our Exhibition.